
HubSpot Reporting & Analytics · Diamond Solutions Partner
Reports your team actually trusts.
Leadership dashboards, sales and attribution reporting, and warehouse sync when native reports hit their limit. Built on clean data, with the people who read them, by the senior specialist who scoped the work.
Sound familiar?
The dashboard says one thing, the spreadsheet another.
Reporting breaks long before the report: in properties nobody filled, stages changed by hand and data that never reached the portal.
-
01
Nobody trusts the numbers
Every meeting starts with “where did this come from?”.
How we prevent itRequired properties, stage rules and validation set before any dashboard is built.
-
02
Reports the portal wasn't set up for
Cross-object, cohort or historical views that the report builder won't do.
How we prevent itDatasets, custom report builder and, when needed, the warehouse and BI layer.
-
03
Data stuck in HubSpot
Finance and analysts work in BI, HubSpot data never gets there.
How we prevent itWarehouse sync and reverse ETL through Insight Connect, so every team reads the same numbers.
Capabilities
From dashboards to data pipelines.
Reports for leadership, sales and data, built by one team.
-
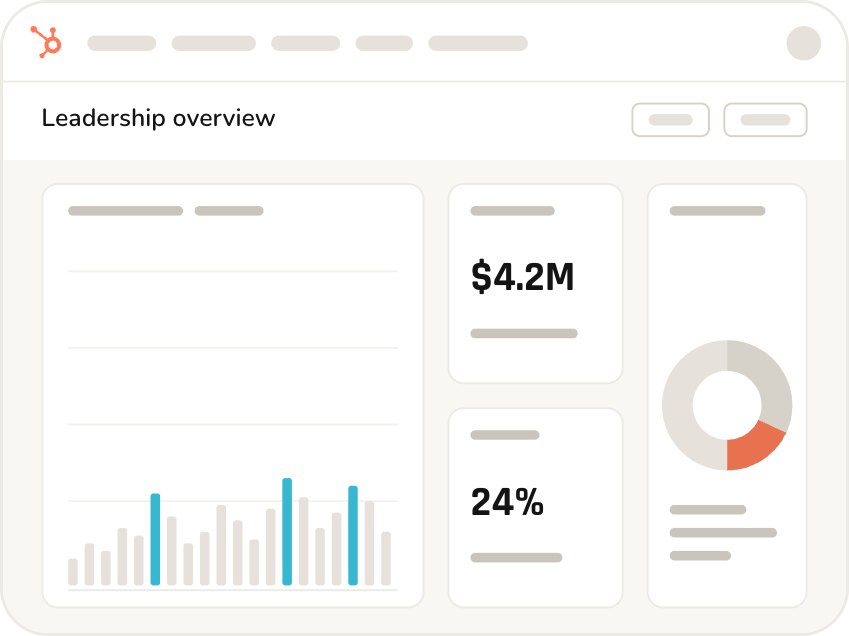
Leadership dashboards
One screen, the numbers the board asks for.
Includes: Revenue overview · Pipeline health · Forecast vs. target
Scope this- Revenue, pipeline and forecast in one view
- Built with the people who present them
- Breeze Assistant set up so your team builds the next report by asking
-
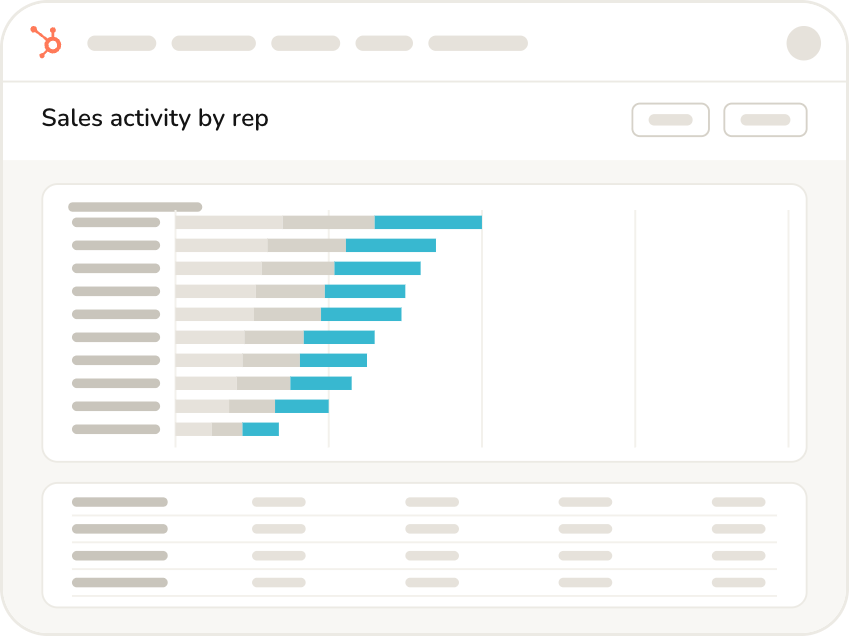
Sales & service reporting
Rep, team, stage and ticket performance you can act on.
Scope this- Forecast categories and weighted pipeline
- Activity and conversion by rep
- Ticket volume, SLA and CSAT by team
-
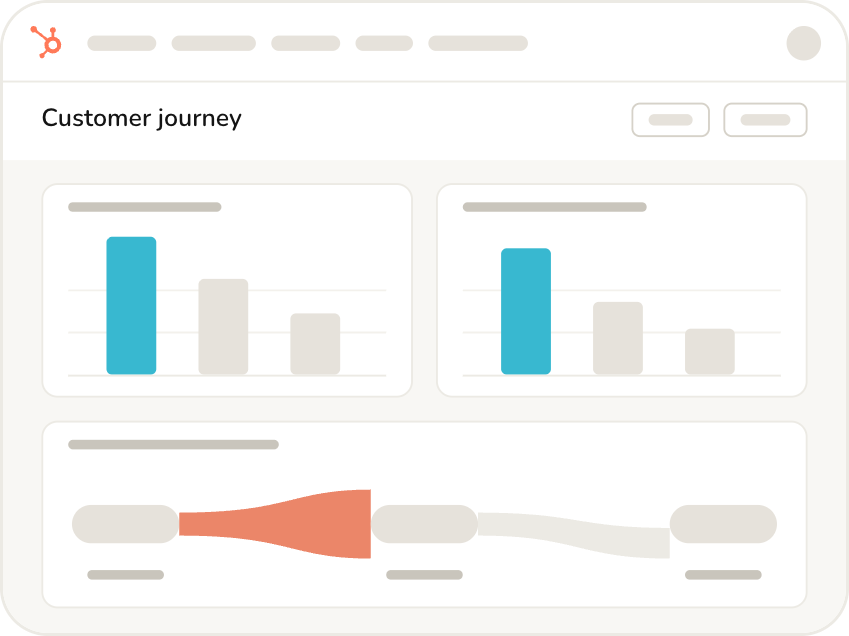
Marketing attribution
Which campaigns move revenue, not just leads.
Scope this- Multi-touch attribution models
- Campaign and channel ROI
- Lifecycle and funnel conversion
-
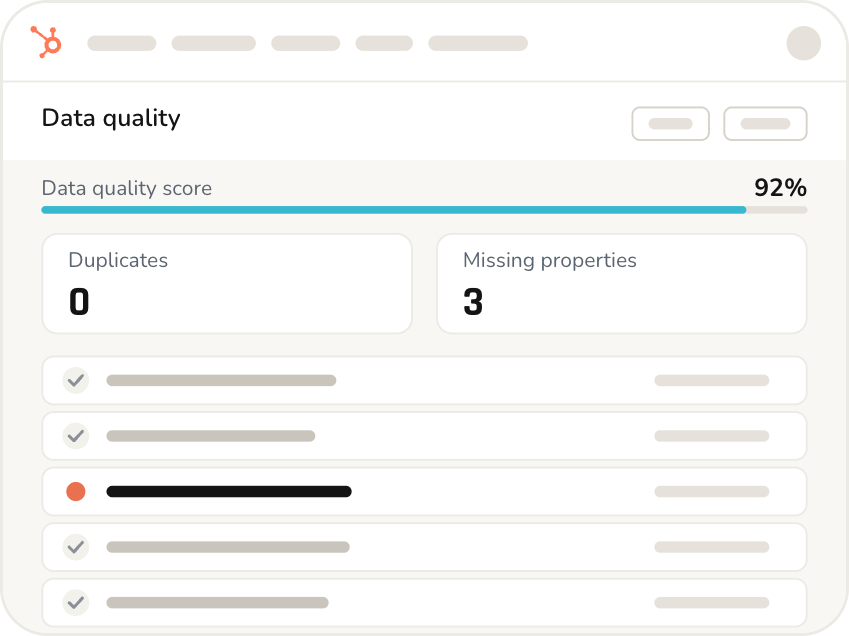
Data quality
Clean data before any chart.
Scope this- Required properties and stage rules
- Deduplication and validation rules
- Data quality dashboard and alerts
-
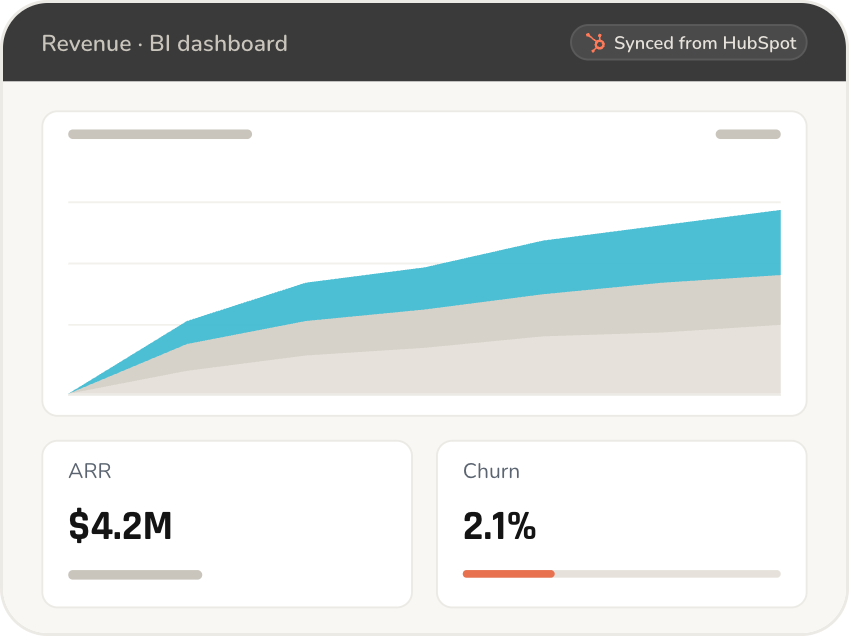
Warehouse & BI
HubSpot in Snowflake, BigQuery, Redshift, Databricks or your own warehouse, and back.
Scope this- Native sync on Data Hub Enterprise, or through Insight Connect on other tiers
- BI dashboards in Looker, Power BI, Metabase or the tool you already use
- Reverse ETL to enrich records
The foundation
Clean data first. Charts second.
A dashboard is only as good as the properties behind it. Before we build a single report we fix what feeds it: required fields, stage rules, lifecycle definitions and deduplication. Then the numbers hold, in HubSpot and in your BI.
The method
Defined once, trusted after.
-
01
Define the metrics
What each number means, who owns it and where it comes from. Agreed in writing before any report is built.
What you get: a metrics dictionary.
-
02
Fix the data
Required properties, stage rules, lifecycle definitions and deduplication, applied to the portal before anything is charted.
What you get: a data quality report.
-
03
Build and review
Dashboards or pipelines built in a sandbox and reviewed with the people who will read them.
What you get: dashboards in a sandbox.
-
04
Hand over and train
Scheduled delivery switched on, documentation delivered, your team trained to edit the reports themselves.
What you get: live dashboards, the docs and a team able to edit them.
Track record
Reports that hold up.
-
300+
HubSpot implementations
-
500+
Projects delivered
-
13 yrs
On HubSpot
-
25
HubSpot certifications
-
5.0
Partner rating

-
“
“Great experience, attentive and competent professionals. Highly recommend hiring them!”
PPedro Del Negro Tayer
GTM Data Engineering at Netlex
-
“
“Extremely qualified professionals. We worked side by side with very positive results. Versatile, agile and up to date with best practices.”
MMalena Figueiredo
Senior Product Manager at eureciclo
-
“
“Excellence in strategy and full HubSpot implementation, far beyond simple configuration. A human, collaborative approach that delivers concrete results quickly.”
TTulio Ferreira
Head of Sales at Estuda
-
“
“It was a great experience. They helped us with everything from choosing the right plan to overcoming the challenges we faced and completing the onboarding process.”
FFelipe Dias
Head of Sales at Teachy.ai
-
“
“They navigate seamlessly between theory, practice and technical depth. Solutions that fit perfectly with our business needs. A truly hands-on company.”
RRaphael Santo
Head of Sales & Customer Success B2B at Quero Educação
-
“
“Technical knowledge, accountability and lots of experience. Implementing HubSpot with them was easy. Professionalism above the average. Highly recommend!”
HHari Aizemberg
Marketing Manager at Koper
-
“
“A partner with complete command of the platform. A year after implementation, the partnership and support remain at the highest level.”
PPedro Silva
Technology Manager at Tambasa
-
“
“Insight showed genuine interest in understanding our product and our challenges. The quality of automations and integrations made all the difference. A truly top-tier partner.”
LLucas Rocha
Co-founder at Data Facts
-
“
“Nothing but great feedback! My biggest regret? Not implementing a CRM sooner. Insight Sales made all the difference.”
FFabricio França Lima
CEO & Founder at Power Tuning
-
“
“Super proactive support. We solved our challenges and have been partners for 5 years! Exceeding expectations from day one.”
HHenrique Vieira
Managing Partner at Colonial Netimóveis
Common questions
HubSpot reporting, answered.
What reports can HubSpot build natively, and where does it stop?
HubSpot's report builder covers most single-object and standard cross-object reports: deals by stage, contacts by source, activity by rep, funnel reports on Professional, and multi-touch revenue attribution on Marketing Hub Enterprise. It stops at historical snapshots beyond what HubSpot stores, cohort analysis, calculations across unrelated objects and anything that needs data from outside the portal. Datasets on Enterprise extend the limit with formula fields and joined objects. Past that, we sync HubSpot to a warehouse and build the view in BI.
Can you build a leadership dashboard in HubSpot?
Yes. A leadership dashboard in HubSpot typically shows revenue closed, open pipeline by stage, forecast against target and marketing-sourced pipeline on one screen, built from native reports and datasets. We define each number with the people who present it, so the board sees the same figure the sales team sees. Scheduled delivery sends it by email or Slack every Monday morning. If the numbers need warehouse data, the same dashboard moves to Looker or Power BI.
How do you make the sales forecast reliable?
By fixing what feeds it. Close dates, amounts and forecast categories become required at the right stage, stage changes follow rules instead of habit, and stale deals are flagged automatically. Then we build the forecast on HubSpot's forecast tool and weighted pipeline reports, with rep and manager submissions where the team uses them. Service reporting is handled the same way: ticket pipelines, SLA rules and CSAT properties are defined before the dashboard is built. The result is a forecast leadership can compare against last quarter instead of a number that changes every Friday.
Does HubSpot do multi-touch attribution?
Yes, on Marketing Hub Professional and Enterprise. HubSpot offers contact create, deal create and revenue attribution reports with first-touch, last-touch, linear, U-shaped, W-shaped and time-decay models. The reports are only as good as the tracking behind them, so we set up campaigns, UTMs, tracked forms and offline source imports before reading them. For channels HubSpot can't see, such as ad spend or events, we join the data in the warehouse.
Can you sync HubSpot to Snowflake, BigQuery, Redshift, Databricks or another warehouse?
Yes. On Data Hub Enterprise the connection to Snowflake, BigQuery, Redshift and Databricks is native, with reverse ETL back into the CRM. On other tiers, or for warehouses HubSpot doesn't connect to, we run the sync through Insight Connect, our middleware. Either way the datasets, dashboards and reverse-ETL rules are built and documented by us.
Which BI tools do you work with?
Looker and Looker Studio, Power BI, Metabase and Tableau most often. The choice usually follows what finance and your analysts already use, not the other way round. We build the dashboards on top of the synced HubSpot data with the same metric definitions used inside HubSpot, so a number in Power BI matches the one in the sales dashboard. Training covers how to extend them without breaking the model.
Can Breeze Assistant build our reports?
It can, and it works well when the data behind it is clean. Breeze builds a report from a plain-language request using your actual properties, so if stages, lifecycle definitions and required fields are consistent the result is reliable. If they aren't, it returns the same wrong number faster. We set up the data model first, then switch Breeze on and train your team to use it.
Do we need a tool like Databox or Supermetrics?
Usually not. For most B2B teams, HubSpot's native dashboards plus a warehouse and BI layer cover everything those tools do, without another subscription or a second copy of the data. We recommend them only when you need to blend many ad and analytics sources into client-facing reports.
Why do you fix the data before building reports?
Because a chart on bad data is wrong with more confidence. If close dates are optional, lifecycle stages are set by hand and duplicates inflate the contact count, every dashboard inherits those errors. We set required properties, stage rules, lifecycle definitions and deduplication first, then build. It adds a step at the start and removes the weekly argument about whose number is right.
Can you fix dashboards we already have?
Yes, and it is a common starting point. We audit the existing dashboards: which reports are used, which numbers disagree, and where the gap comes from, usually missing properties or inconsistent stages. Then we fix the data, rebuild the reports worth keeping and retire the rest. You get the findings in writing before we change anything.
How much does HubSpot reporting setup cost?
It depends on the number of dashboards, the state of the data and whether a warehouse and BI layer is involved, so we quote a fixed price after a scoping call. A leadership dashboard on clean data is a small project; a warehouse sync with BI dashboards and reverse ETL is a larger one. The scoping call is free and you get a written approach with scope and price before anything is built. No open-ended hourly billing.
Who maintains the dashboards after go-live?
Your team can, and we can if you prefer. Every project ends with documentation, a metrics dictionary and training, so an admin can edit a report or add a tile without calling us. Many clients keep us on a monthly retainer through HubSpot Managed Services for changes, new reports and data quality monitoring. Either way nothing depends on a single person's memory.
Talk to us
Which number can't you trust?
Tell us which report your team argues about and where the data lives today. A specialist reads every message and replies with a scoped approach.
Average reply time under 2 business hours.
All fields required